- Jul 14, 2026
- admin
- 0
Playwright Reports
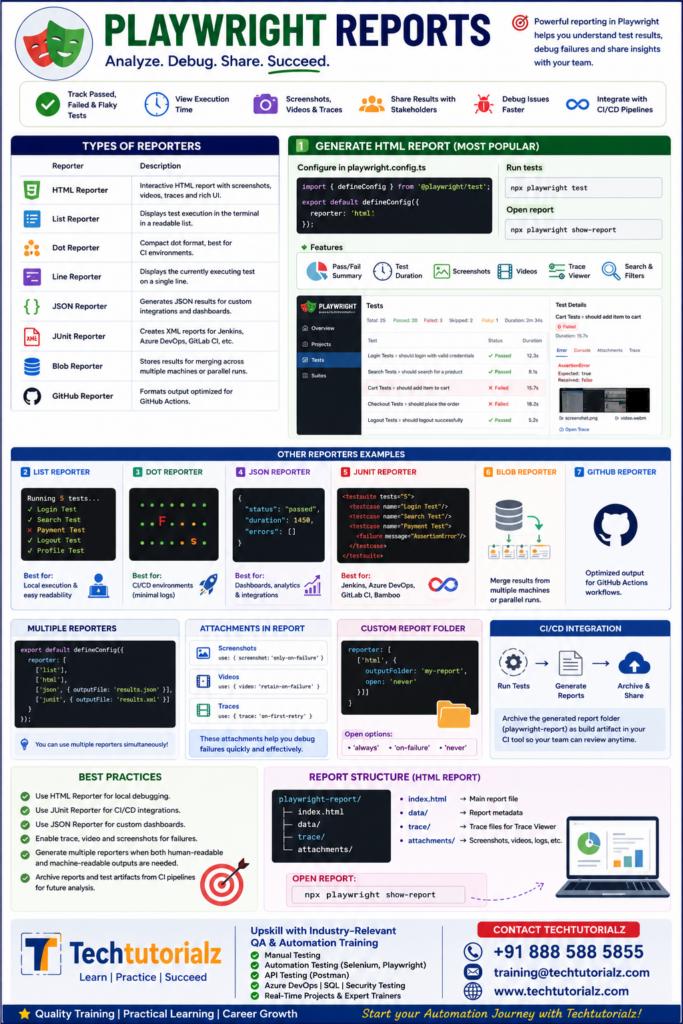
Playwright provides powerful reporting features that help you analyze test execution, identify failures, debug issues, and share results with your team.
Why are Playwright Reports Important?
- ✅ View passed, failed, skipped, and flaky tests
- ✅ Track execution time
- ✅ Analyze screenshots, videos, and traces
- ✅ Share results with stakeholders
- ✅ Debug failed test cases quickly
- ✅ Integrate with CI/CD pipelines (Azure DevOps, GitHub Actions, Jenkins)
Types of Reports in Playwright
| Report Type | Description |
| HTML Report | Interactive report with screenshots and traces |
| List Reporter | Displays test execution in the terminal |
| Dot Reporter | Compact output for CI environments |
| Line Reporter | Updates test status on a single line |
| JSON Reporter | Generates JSON results for integrations |
| JUnit Reporter | Creates XML reports for Jenkins, Azure DevOps, etc. |
| Blob Reporter | Stores test results for merging across multiple runs |
| GitHub Reporter | Formats output for GitHub Actions |
- HTML Report (Most Popular)
Generates a rich interactive report after test execution.
Configure
import { defineConfig } from ‘@playwright/test’;
export default defineConfig({
reporter: ‘html’
});
Run tests
npx playwright test
Open report
npx playwright show-report
Features
- Beautiful UI
- Passed/Failed tests
- Test duration
- Error messages
- Stack trace
- Screenshots
- Videos
- Trace Viewer
- Search functionality
List Reporter
reporter: ‘list’
Output
Running 5 tests…
✓ Login Test
✓ Search Test
✘ Payment Test
✓ Logout Test
Best for
- Local execution
- Easy readability
Dot Reporter
reporter: ‘dot’
Output
…..
..F..
….
Best for
- CI/CD
- Minimal console logs
Line Reporter
reporter: ‘line’
Displays the current executing test on a single console line, reducing log clutter.
JSON Report
reporter: [
[‘json’, { outputFile: ‘results.json’ }]
]
Produces
{
“status”: “passed”,
“duration”: 1450
}
Useful for
- Dashboards
- Custom reporting
- Analytics
JUnit Report
reporter: [
[‘junit’, { outputFile: ‘results.xml’ }]
]
Used by
- Jenkins
- Azure DevOps
- Bamboo
- GitLab CI
Example XML
<testsuite>
<testcase name=”Login Test”/>
</testsuite>
Blob Report
reporter: ‘blob’
Useful when:
- Running tests in parallel
- Merging reports from multiple machines
- Distributed test execution
Multiple Reporters
You can generate more than one report simultaneously.
export default defineConfig({
reporter: [
[‘list’],
[‘html’],
[‘json’, {
outputFile: ‘results.json’
}],
[‘junit’, {
outputFile: ‘results.xml’
}]
]
});
HTML Report Structure
playwright-report/
index.html
data/
trace/
attachments/
Screenshots in Reports
use: {
screenshot: ‘only-on-failure’
}
Automatically attaches screenshots for failed tests.
Videos in Reports
use: {
video: ‘retain-on-failure’
}
Videos are attached to failed test cases.
Trace Viewer
use: {
trace: ‘on-first-retry’
}
The HTML report includes a link to open the trace, allowing you to inspect:
- Every user action
- Network requests
- Console logs
- DOM snapshots
- Timing information
Custom Report Folder
reporter: [
[‘html’, {
outputFolder: ‘my-report’,
open: ‘never’
}]
]
Automatically Open Report
reporter: [
[‘html’, {
open: ‘always’
}]
]
Options
- always
- never
- on-failure
Report with Retries
retries: 2,
use: {
trace: ‘on-first-retry’,
screenshot: ‘only-on-failure’,
video: ‘retain-on-failure’
}
This configuration helps diagnose flaky tests by collecting rich artifacts on retries.
Report in CI/CD
npx playwright test
npx playwright show-report
Archive the generated report folder (playwright-report) as a build artifact in your CI tool so teammates can review it after the pipeline completes.
Best Practices
- Use HTML Reporter for local debugging.
- Use JUnit Reporter for CI/CD integrations.
- Use JSON Reporter for custom dashboards.
- Enable trace, video, and screenshots for failures.
- Generate multiple reporters when both human-readable and machine-readable outputs are needed.
- Archive reports and test artifacts from CI pipelines for future analysis.
Common Interview Questions
- What are the different types of Playwright reporters?
- How do you generate an HTML report?
- How do you open the Playwright report?
- How do you configure multiple reporters?
- What is the difference between HTML and JUnit reports?
- How do you include screenshots and videos in reports?
- What is the Blob reporter, and when would you use it?
- How do you customize the report output folder?
- How do you integrate Playwright reports with Jenkins or Azure DevOps?
- How does Trace Viewer help debug failed tests?
Sample playwright.config.ts
import { defineConfig } from ‘@playwright/test’;
export default defineConfig({
retries: 2,
reporter: [
[‘list’],
[‘html’, {
outputFolder: ‘playwright-report’,
open: ‘on-failure’
}],
[‘junit’, {
outputFile: ‘results.xml’
}],
[‘json’, {
outputFile: ‘results.json’
}]
],
use: {
screenshot: ‘only-on-failure’,
video: ‘retain-on-failure’,
trace: ‘on-first-retry’
}
});
This configuration is a common real-world setup because it provides rich HTML reports for developers, XML output for CI servers, JSON for integrations, and debugging artifacts (screenshots, videos, and traces) when tests fail.