
- Jul 13, 2026
- admin
- 0
Trace Viewer in Playwright
What is Trace Viewer?
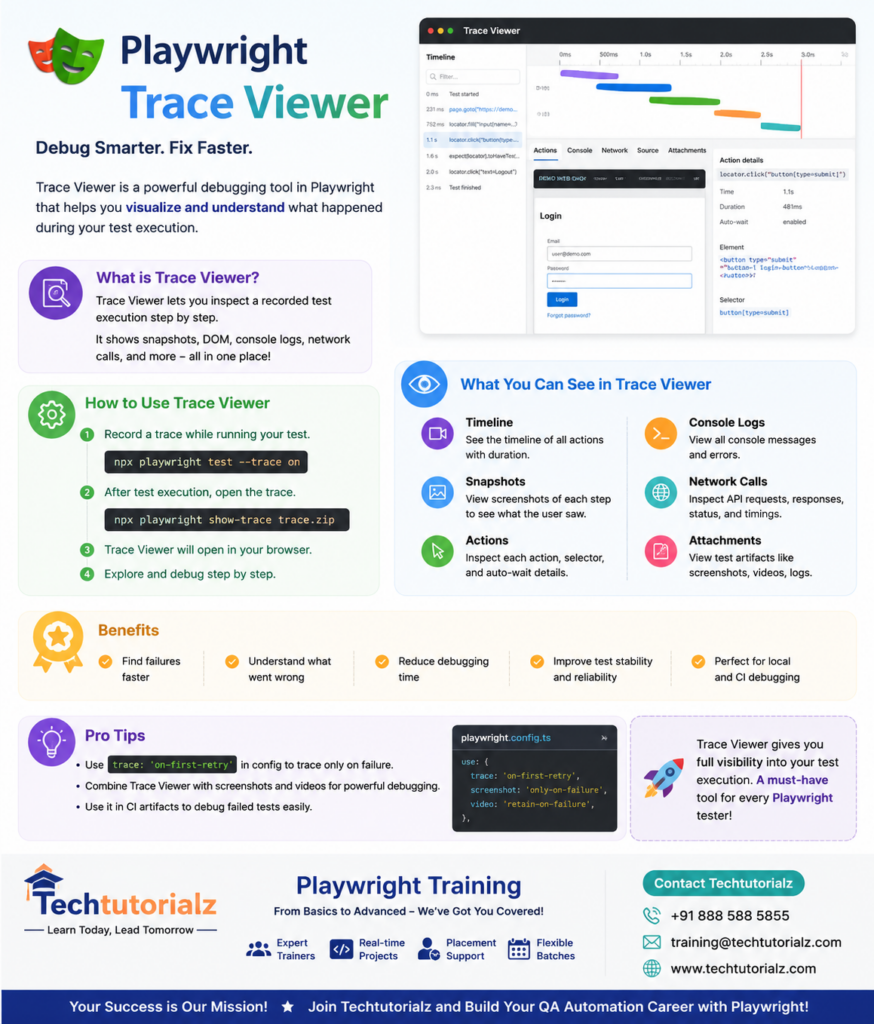
Trace Viewer is one of Playwright’s most powerful debugging tools. It records everything that happens during a test execution and lets you replay the test step by step after it finishes.
Think of it as a “DVR for your Playwright tests.” Instead of guessing why a test failed, you can replay the execution and inspect every action.
Why Use Trace Viewer?
✅ Replay failed tests step-by-step
✅ View screenshots for every action
✅ Inspect DOM snapshots
✅ See network requests and responses
✅ View console logs
✅ Check timings for each action
✅ Debug flaky tests easily
Enable Trace Viewer
Option 1: Record Trace on First Retry (Recommended)
// playwright.config.ts
import { defineConfig } from ‘@playwright/test’;
export default defineConfig({
use: {
trace: ‘on-first-retry’
}
});
Trace is recorded only if the test fails and retries.
Option 2: Always Record
use: {
trace: ‘on’
}
Records traces for every test.
Option 3: Retain Only on Failure
use: {
trace: ‘retain-on-failure’
}
Keeps traces only for failed tests.
Trace Modes
| Mode | Description |
| off | No tracing |
| on | Trace every test |
| retain-on-failure | Keep trace only if test fails |
| on-first-retry | Record only during first retry (Best Practice) |
| on-all-retries | Record on every retry |
Example Test
import { test, expect } from ‘@playwright/test’;
test(‘Login Test’, async ({ page }) => {
await page.goto(‘https://opensource-demo.orangehrmlive.com’);
await page.fill(‘input[name=”username”]’, ‘Admin’);
await page.fill(‘input[name=”password”]’, ‘admin123’);
await page.click(‘button[type=”submit”]’);
await expect(page).toHaveURL(/dashboard/);
});
If this test fails, Playwright generates a trace.
Running Tests
npx playwright test
If tracing is enabled, a .zip trace file is created.
Example:
test-results/
login-test/
trace.zip
Open Trace Viewer
Method 1
npx playwright show-trace trace.zip
Method 2
npx playwright show-report
Click the failed test and then select Trace.
What Can You See?
Timeline
Shows every Playwright action in chronological order.
Goto
↓
Fill Username
↓
Fill Password
↓
Click Login
↓
Dashboard Loaded
Action Log
Displays every action with:
- Click
- Fill
- Hover
- Press
- Wait
- Assertions
DOM Snapshot
Inspect the exact page structure at any recorded step.
Screenshots
Each action includes a screenshot, making it easy to identify UI issues.
Network Tab
View:
- API requests
- Response status
- Headers
- Payloads
- Response bodies
Useful for debugging API failures alongside UI tests.
Console Logs
Inspect browser console output:
Console.log()
Console.error()
Console.warn()
Source Code
The viewer highlights the exact line of your test corresponding to the selected action.
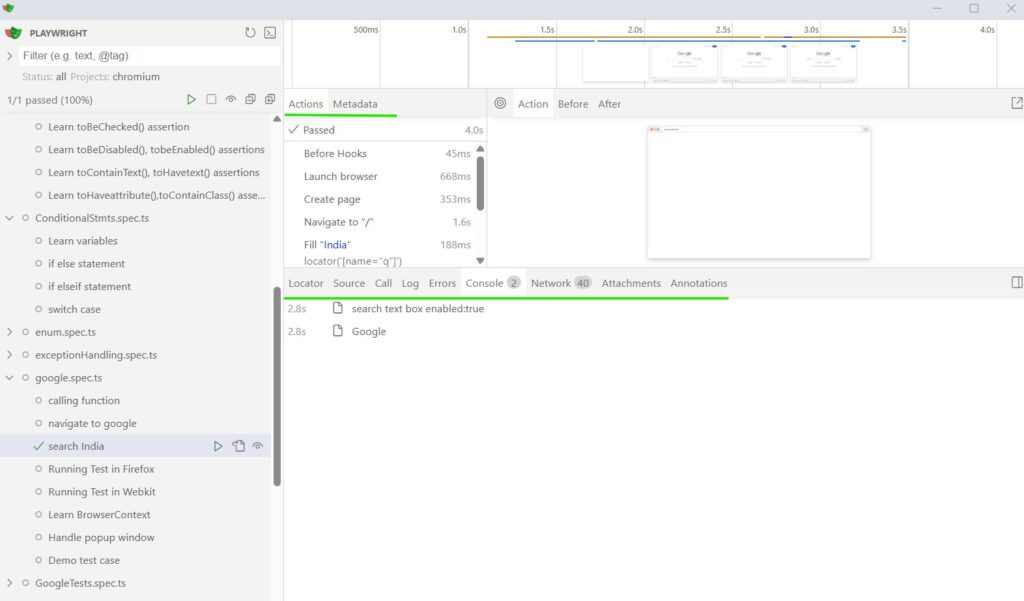
Trace Viewer Layout
—————————————–
Timeline
—————————————–
Action List
—————————————–
Browser Snapshot
—————————————–
Network | Console | Source | Metadata
—————————————–
Record Trace Manually
import { test } from ‘@playwright/test’;
test(‘Manual Trace’, async ({ page, context }) => {
await context.tracing.start({
screenshots: true,
snapshots: true
});
await page.goto(‘https://example.com’);
await context.tracing.stop({
path: ‘trace.zip’
});
});
Best Practices
- Use trace: ‘on-first-retry’ for CI/CD to minimize storage while capturing failures.
- Combine Trace Viewer with screenshots and video recording for comprehensive debugging.
- Avoid recording traces for every test in large suites unless necessary, as it increases execution time and disk usage.
- Share the generated trace.zip with teammates to reproduce and investigate failures without rerunning the tests.
When Should You Use Trace Viewer?
- Debugging failed UI tests
- Investigating flaky or intermittent failures
- Understanding unexpected test behavior
- Reviewing API calls made during a test
- Verifying page state at each execution step
- Collaborating with teammates by sharing trace files
Interview Question
Q: Why is Trace Viewer considered one of Playwright’s biggest advantages over many traditional automation tools?
Answer: Trace Viewer provides a complete replay of test execution—including screenshots, DOM snapshots, network activity, console logs, source code, and timing information—in a single interactive interface. This significantly reduces debugging time and makes diagnosing failures much easier, especially for flaky tests and CI/CD failures.
Master Playwright from Scratch! Explore our complete Playwright Tutorial collection covering:
- Playwright Basics
- Locators
- Assertions
- Timeouts
- Browser Context
- Frames & iFrames
- Auto Waiting & Timeouts
- API Testing
- Network Interception
- Authentication
- Fixtures
- Parallel Execution
- CI/CD
- AI in Playwright
👉 Browse all Playwright tutorials: Playwright Tutorial